Apartment_Rent_Analysis
Predicting Rent Prices in Albuquerque Metropolitan Area
Project Goals
Contracted to analyze apartment metrics to build a model to predict rent prices and apartment occupancy from relevant features. Data will be used to competetively price apartment rent and predict occupancy for profit analysis. Resulted in a model with less than 5% error rate using ensemble machine learning methods.
Data Cleaning
The first step in the data analysis was to examine the data. There were many missing or incorrect values, so we replaced invalid entires with either the mean or mode, depending on the specific feature. This was done to improve the quality of the dataset, without removing rows from an already sparse data source.
We also remove features such as the apartment complex name, sub market, etc as they do not have any relationship with our predictors.
Here are the statistics for each feature:
| Feature | Mean | Median | Mode | Minimum | Maximum | Standard Deviation |
|---|---|---|---|---|---|---|
| Units | 209.2893 | 77 | 240 | 46 | 573 | 114.4006 |
| Bedrooms | 1.6309 | 2 | 2 | 1 | 4 | 0.7115 |
| Size | 854.8595 | 840 | 800 | 109 | 1751 | 271.1651 |
| Bathrooms | 1.3795 | 1 | 1 | 1 | 3 | 0.4931 |
| Rent | $601.04 | $715 | $599 | $310 | $2,437 | $152.82 |
| Occupancy | 89.3106% | 100% | 100 | 36% | 100% | 9.0944% |
| Zip Code | 67671.6736 | 87111 | null | 87048 | 87123 | 17132.2395 |
| Age | 1820.5799 | 1965 | null | 2 | 2011 | 196.1572 |
Data Visualization & Analysis
The data then needed to be visualized to examine given features and their relationship to our two output features- rent and occupancy. The graphs found below start telling the story of our data:
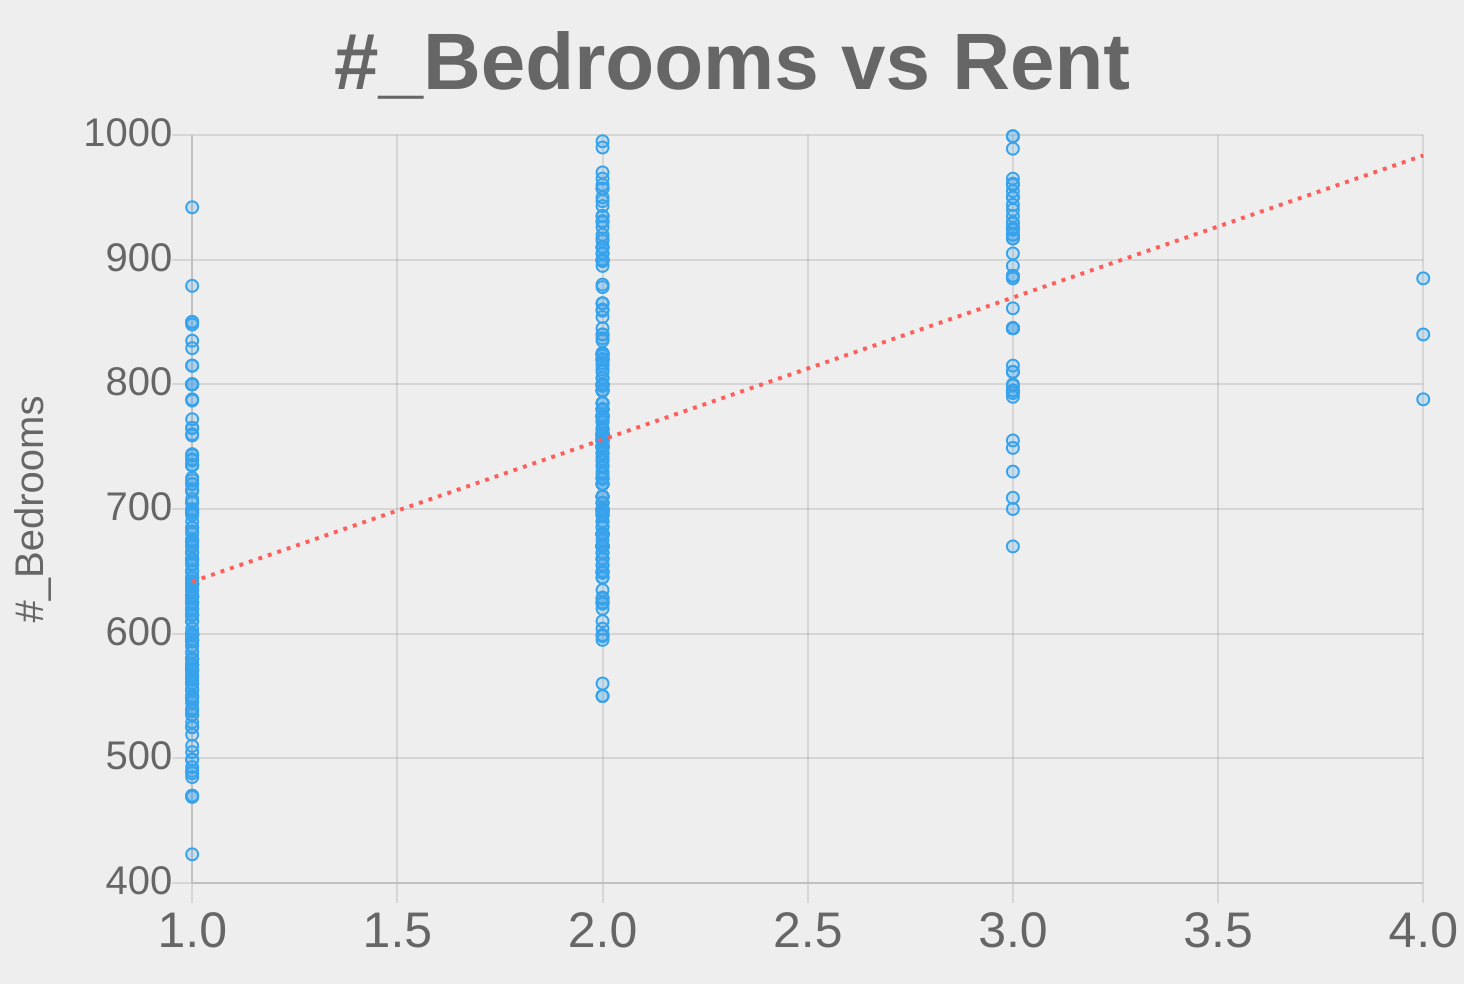
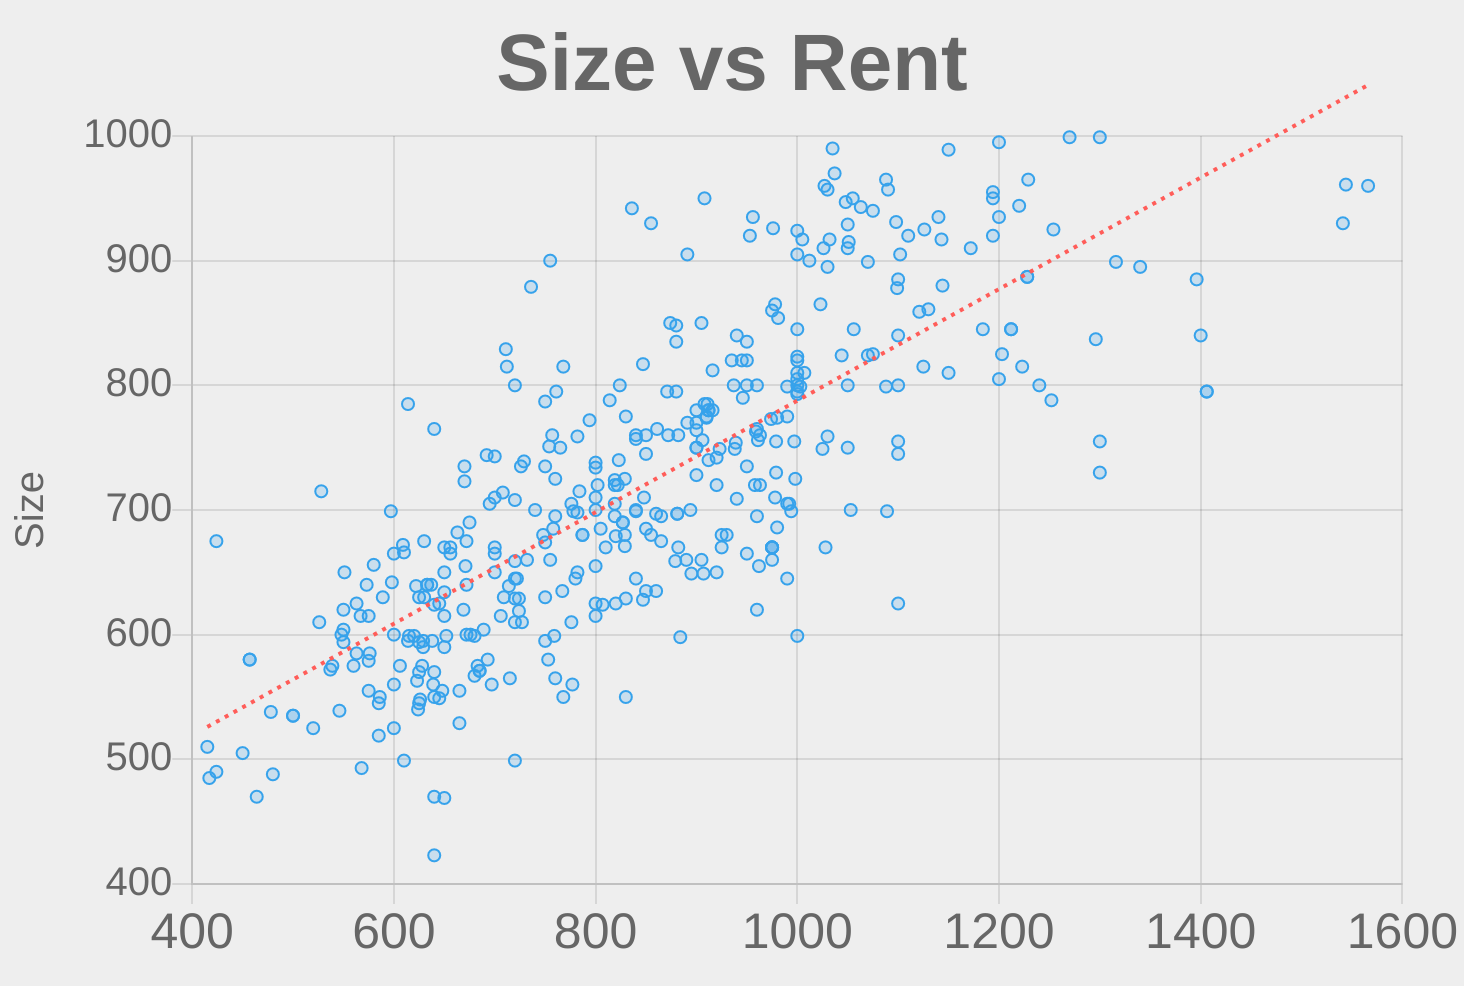

As you can see, the size of a unit and the number of bedrooms (and bathrooms) are positively correlated with the rent. This intuitively makes sense, as we expect large apartments with more amenities to be more expensive.
Interestingly enough, the number of units in an apartment complex is negatively correlated with occupancy. This is likely due to large apartment complexes having longer occupancy between renters.
We then use a correlation matrix to confirm our visual suspicions:
| Feature | Rent | Occupancy |
|---|---|---|
| Units | 9% | -22% |
| Bedrooms | 40% | 8% |
| Size | 39% | -6% |
| Bathrooms | 34% | -3% |
| ZIP | 100% | 100% |
| Age | 100% | 100% |
The correlation matrix reflects what we learned from visualizing the data, but also brings up an alarming feature- both the zip code and age of the apartment complex are both highly correlated with rent and occupancy. Further inspection reveals that due to the sparse data, most zip codes and ages are unique, which explains the high correlation. We will remove these features, as it is unlikely they will generalize well to new sample data.
Model Building and Analysis
The next step in our process is to build a model. We use a simple feedforward network with a small number of hidden layers. Data is normalized to prevent training errors. Initial results were promising, but using a gradient boosting technique and hyperparameter tuning lowered the error of our model. Evaluation on the test dataset revealed the following errors:
| Feature | Mean Percent Absolute Error |
|---|---|
| Rent | 4.87% |
| Occupancy | 5.07% |
Query Model:
Rent:
Occupancy:
Results and Future Work:
The generated model has great accuracy for predicting rent prices, with an acceptable error rate. The main issue with the current model centers around the lack of market data. The model could be improved with more data points and extended to other areas and markets. More data would likely make location information more relevant in the model, which we know to be correlated with price.
It would also be interesting to include a single image of the property in the pipeline, to try and quantify the aesthetic value of the property. This could be trained using the same network with a convolutional neural network used to downsample features of the image into an input vector.